
How Manifst calculates the budget (earned value)
BAC, planned value, earned value, actual cost, indices and forecast at completion: what each figure in the Budget tab says, and where it comes from.
- Plan
- All plans
- Required permission
- Finance › Access pageDefault: Product Owner, Project Manager, Project Management Officer, plus the project owner and admins.
The idea in one sentence
The earned value method (EVM) compares three amounts expressed in the same unit, euros: what was planned to date, what has been produced and what has been spent. Manifst calculates them from your sprints and story points, against the budget you declared.
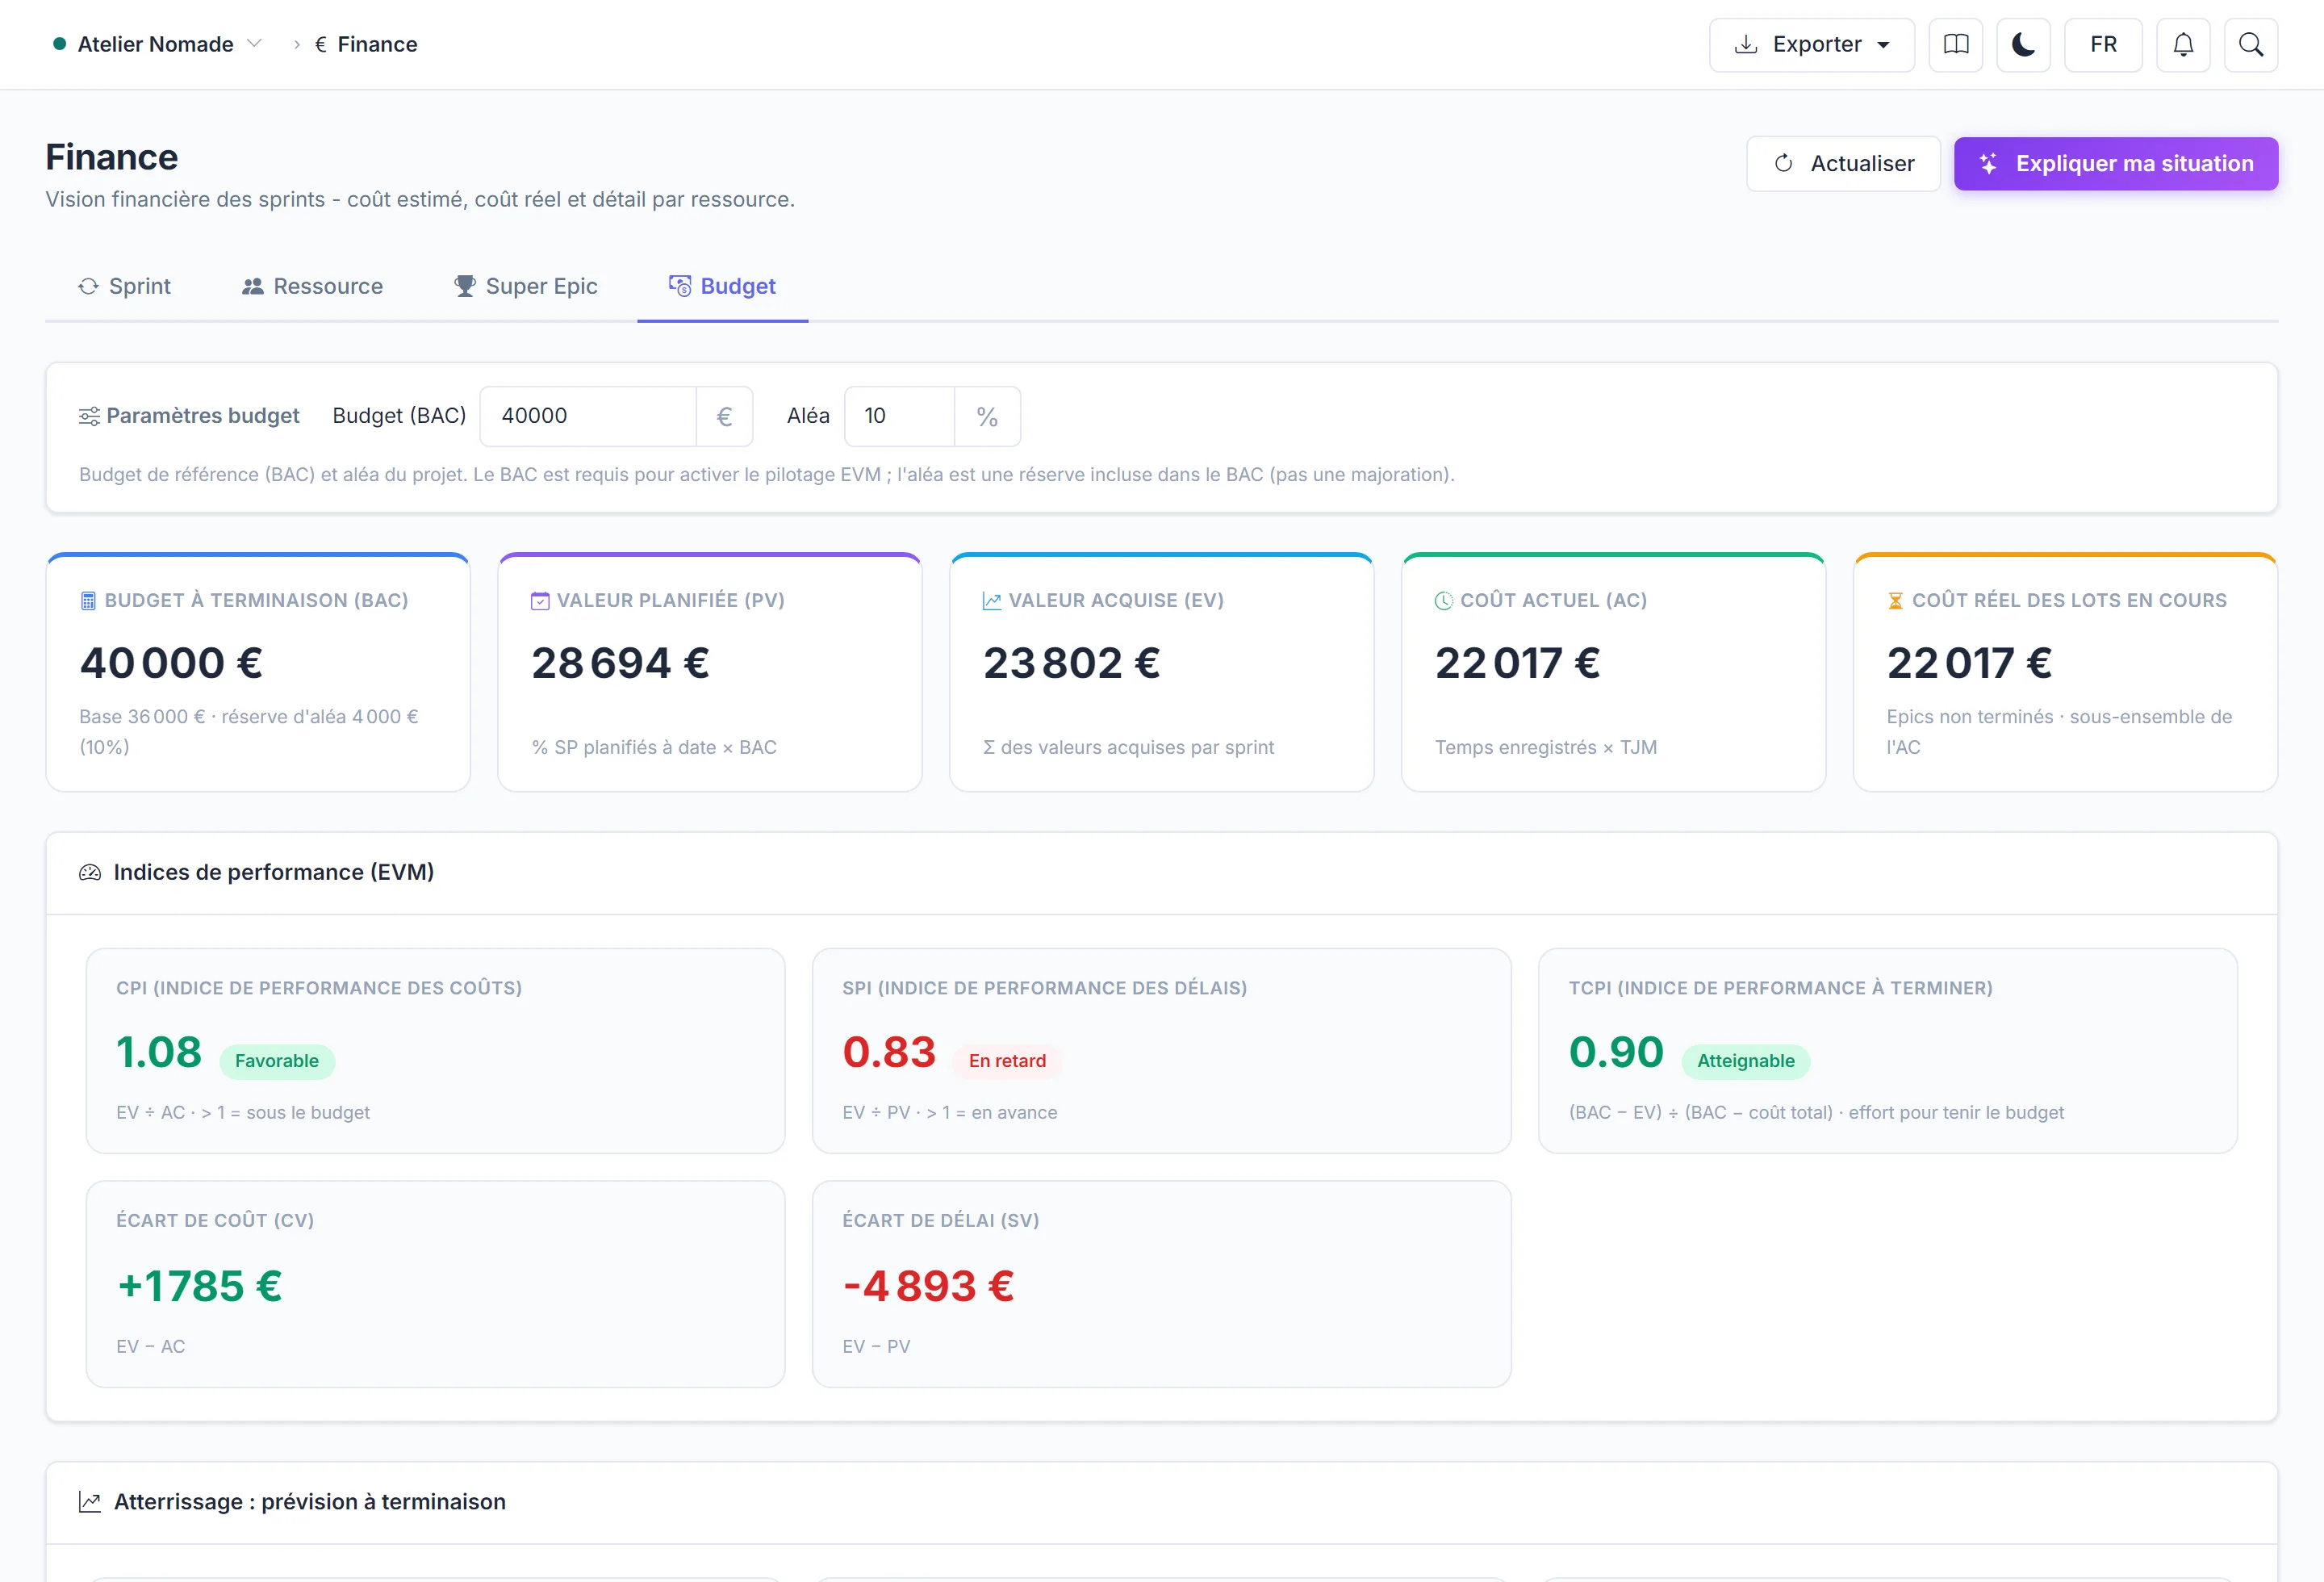
The three amounts
| Amount | Question | Calculation in Manifst |
|---|---|---|
| BAC, budget at completion | How much should the project cost? | the amount entered in Finance › Budget |
| Planned value (PV) | How much should have been produced by today? | share of points planned to date × BAC |
| Earned value (EV) | What is the delivered work worth? | share of points completed × BAC |
| Actual cost (AC) | How much has been spent? | logged time × daily rate in force on the work date |
The "shares of points" are calculated over the sprint scope: the total story points of tickets placed in a sprint, past, current or future. Tickets left in the backlog are not included.
Plan your sprints for the calculation to make sense
If only one sprint is planned, the whole BAC is assigned to it: completing it gives the impression the whole project is delivered. The more of the project the sprints cover, the more faithful the indicators.
The planned value to date moves with the calendar: for a sprint halfway through (in working days), half of its points are considered planned.
The indices
| Index | Calculation | Reading |
|---|---|---|
| CPI, cost performance | EV ÷ AC | above 1: you produce more than you spend |
| SPI, schedule performance | EV ÷ PV | above 1: you are ahead of plan |
| Cost variance (CV) | EV − AC | positive: savings; negative: overrun |
| Schedule variance (SV) | EV − PV | positive: ahead; negative: behind |
An index is shown in green only if it is strictly above 1; at exactly 1, it is neutral.
Forecast at completion
The forecast answers "how much will the project cost in total if the trend continues?":
- Estimate to complete (ETC) = (BAC − EV) ÷ CPI;
- Estimate at completion (EAC) = everything already spent + estimate to complete;
- Variance at completion (VAC) = BAC − EAC;
- To-complete performance (TCPI): the CPI you would need to hold until the end to stay within the BAC.
Example
BAC of €100,000, 200 points planned in sprints, 80 points completed, €50,000 spent.
- EV = 80 ÷ 200 × 100,000 = €40,000
- CPI = 40,000 ÷ 50,000 = 0.8: each euro spent produces €0.80 of value
- Estimate to complete = (100,000 − 40,000) ÷ 0.8 = €75,000
- Estimate at completion = 50,000 + 75,000 = €125,000, i.e. €25,000 over budget
Three rules behind surprising figures
- Delivering more than planned in a sprint does not create budget. A sprint's earned value is capped at what it had planned: a ticket added during the sprint and then completed does not push value above the BAC.
- Time logged outside a sprint costs, but produces no value. It does not enter the CPI (which compares amounts of the same scope), but it counts in the forecast at completion: the money has really been spent.
- Contingency is included in the BAC, not added to it: with a BAC of €100,000 and 10% contingency, the reserve is €10,000 out of those €100,000.
An "Abandoned" ticket counts as done
A ticket counts as delivered as soon as its status is of the "Done" type. If your project has an abandonment status of that type, its tickets inflate the earned value. Check your columns' type in Kanban.
For details on actual cost, see How actual cost is calculated.