
Steer with the dashboard
Build your dashboard from blocks (progress, velocity, budget, forecasts…), create your own charts and export it.
What it shows
The Dashboard is a project's home page: a grid of blocks summarising its state (sprint progress, velocity, blocked tickets, budget, forecasts…). When a block has an ⓘ icon, hover over it to see how it is calculated.
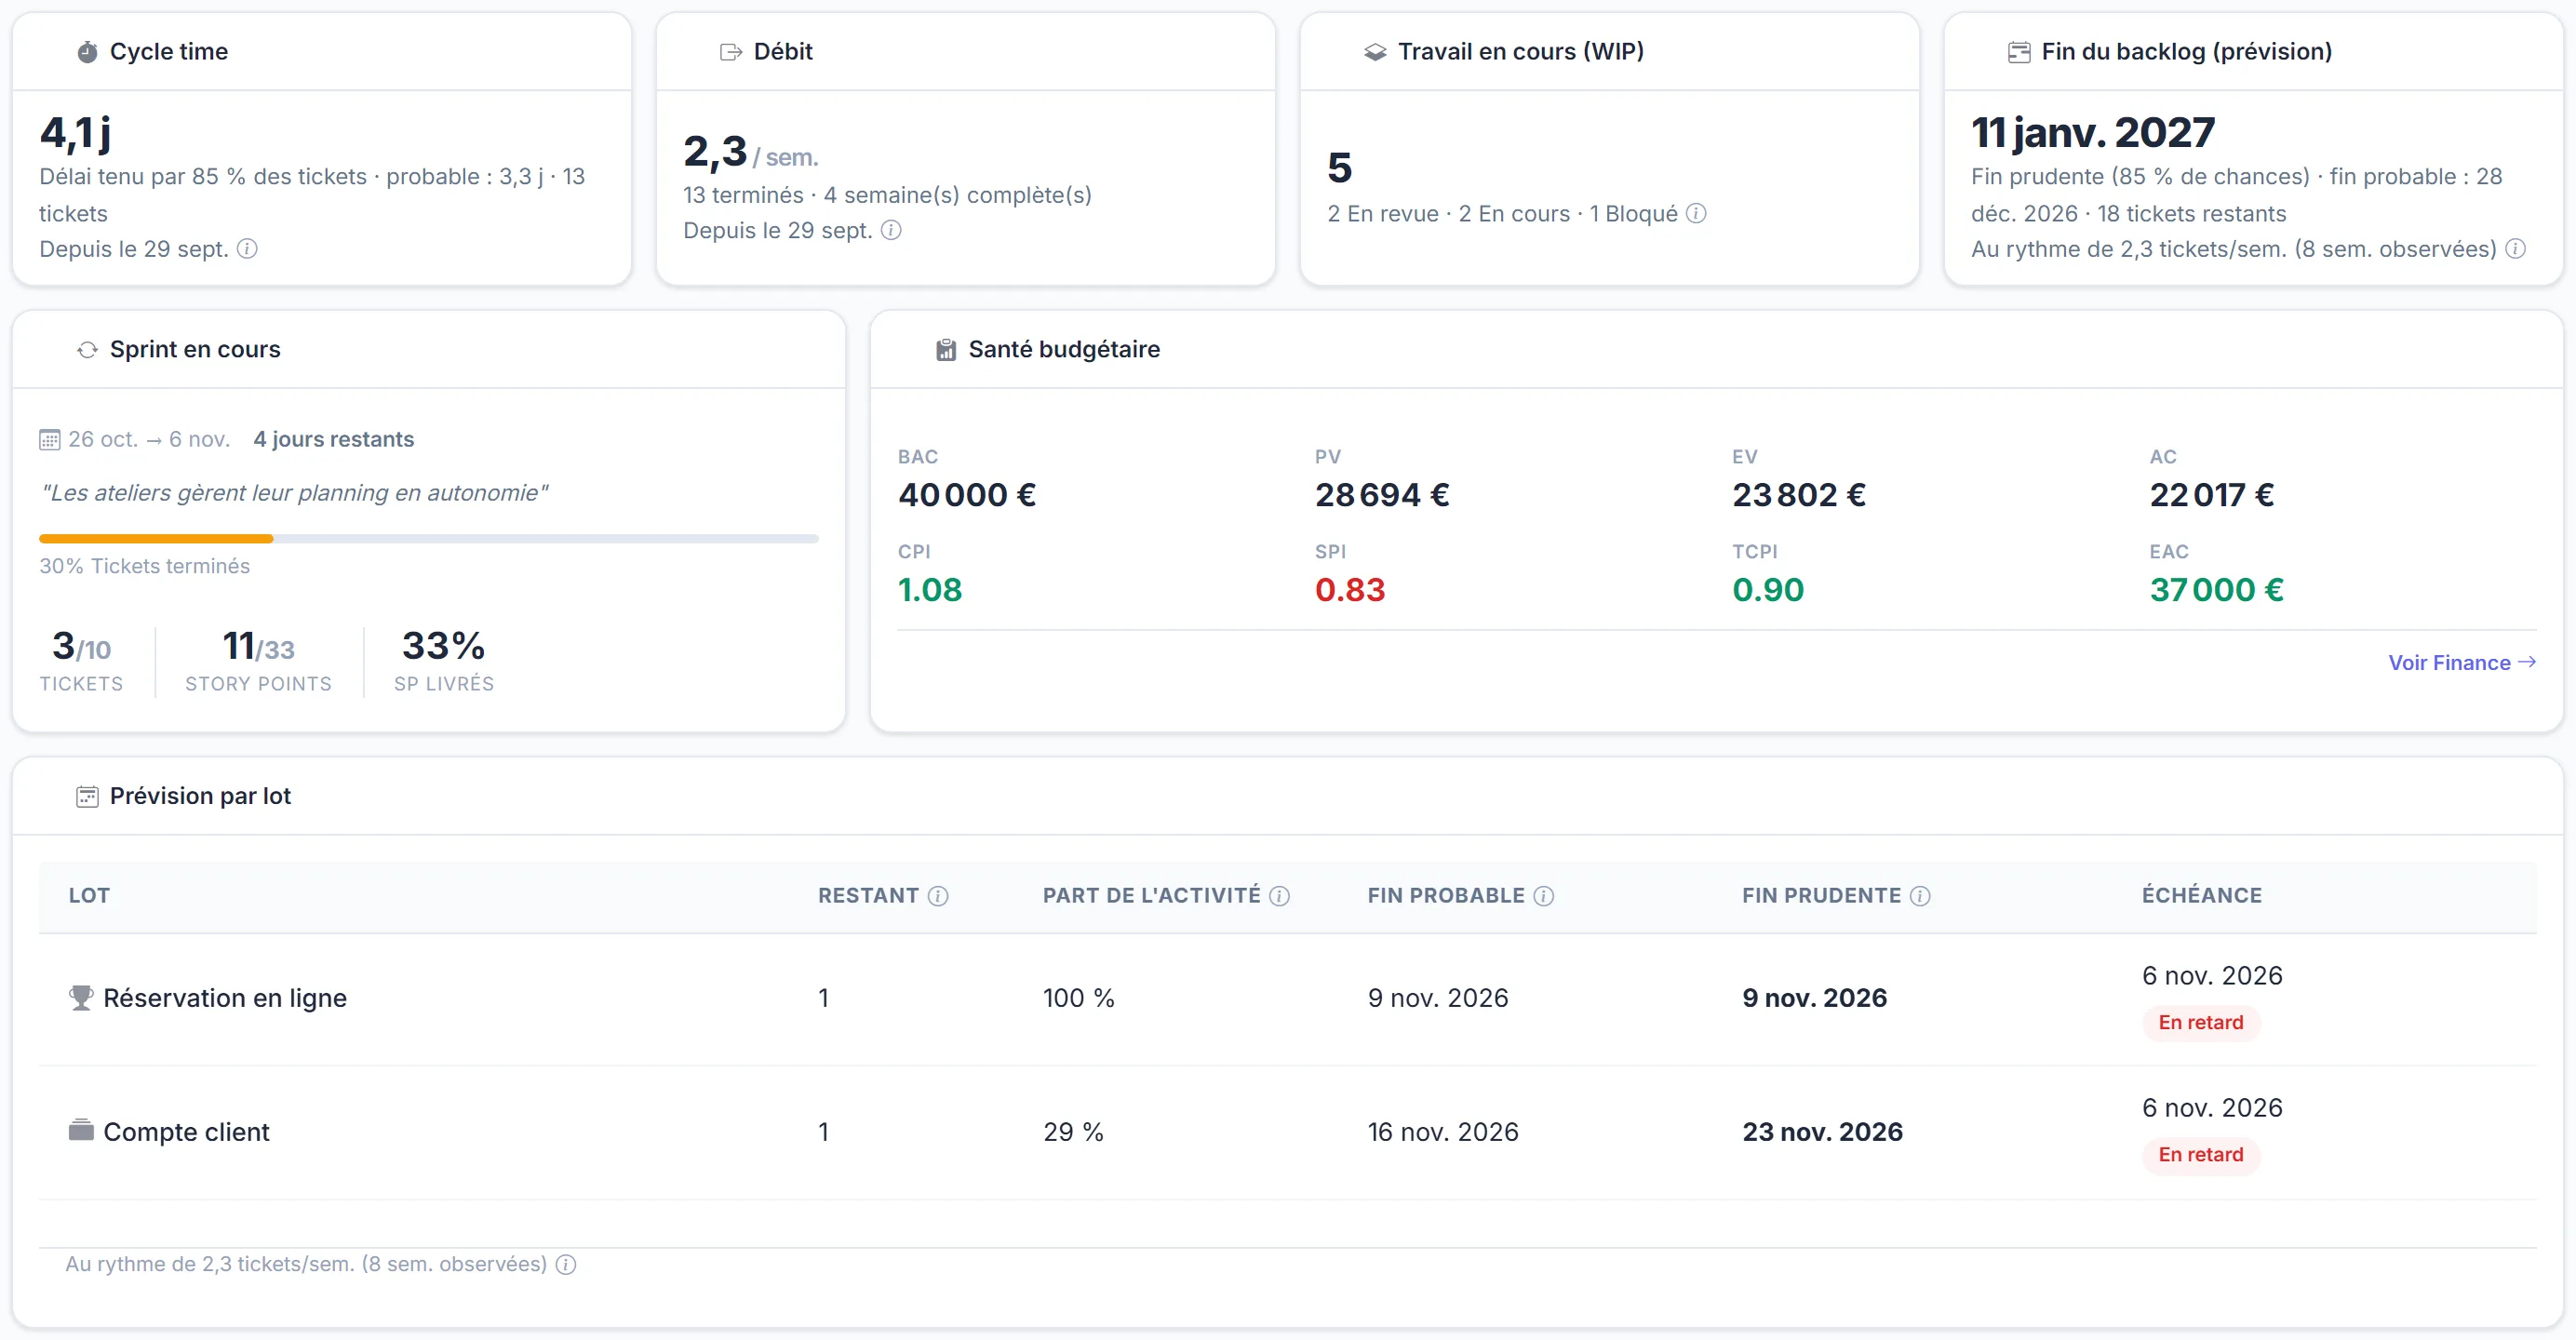
Budget blocks are only shown to people who have access to the Finance page.
Customise it
- Click Customize: the dashboard switches to edit mode.
- Drag blocks to move them, and resize them from their corners and edges.
- Add block opens the catalogue of available blocks. Create chart builds a chart from your own criteria.
- Click Finish.
The layout is personal and per project: yours changes nothing for your colleagues.
Export it
Export › PowerPoint produces a deck of the blocks shown, in their order. The PowerPoint export is included from the Team plan.
Discover the page step by step
The dashboard's ? button replays the guided tour.